Extract NCI funding numbers with tabulizer
One of the problems with the NIH Funding Facts, which I’ve used in an earlier post, is that it has missing data in some important places. First, it only goes back to 1998 and you might want to look at trends even before that. Second, it has missing data in some unpredictable places. For instance, you can see below that National Cancer Institute (NCI) R01 funding is missing from 1998 to 2005. The NCI is one of the biggest NIH institutes by funding, so that’s pretty valuable information we might want to know.

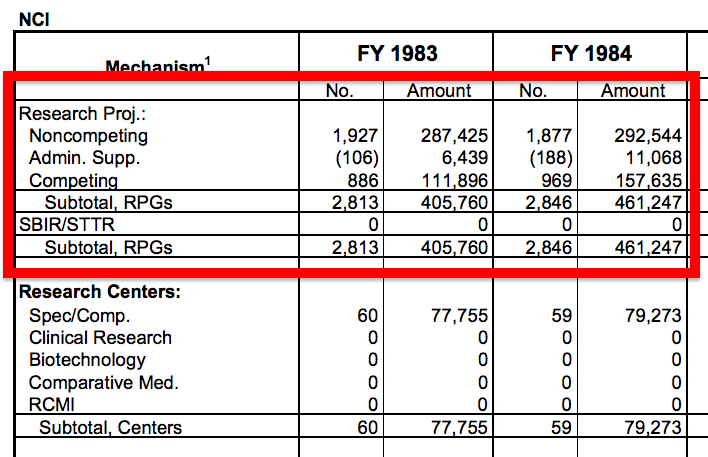
One place you might try to get this data is the NIH Office of Budget. It doesn’t break down spending by activity codes (so you can’t, say, look only at spending on R01 grants), but it goes back all the way to 1983 so you can get a longer time series of NIH spending.
The problem? The data is in a PDF (oh god why?!), so we have to find a way to extract it. For the sake of reproducibility and accuracy, I want to avoid copying and posting numbers directly from the document as much as possible.
The tabulizer package works pretty well for this since the data is in a table.1 We still have to do some “manual” work because of the table’s structure. Using the tabulizer::extract_areas function, you can interactively specify the area of the PDF where you have a table to be extracted.2
# Code to extract tables
datadir = str_c(here(), "/data")

# Download PDFs
download.file("https://officeofbudget.od.nih.gov/pdfs/spending_history/Mechanism%20Detail%20by%20IC,%20FY%201983%20-%20FY%201999.pdf", destfile = str_c(datadir, "/ic_funds_83_99.pdf"))
download.file("https://officeofbudget.od.nih.gov/pdfs/FY17/Mechanism%20Detail%20by%20IC%20FY%202000-FY%202015%20V.pdf", destfile = str_c(datadir, "/ic_funds_00_15.pdf"))

library(tabulizer)

# Enter interactive mode to select desired tables, which are returned as a list
nci_83_99 = extract_areas(str_c(datadir, "/ic_funds_83_99.pdf"), pages = 1:2,
                          method = 'data.frame')
nci_00_15 = extract_areas(str_c(datadir, "/ic_funds_00_15.pdf"), pages = 1:2,
                          method = 'data.frame')

nci_83_15 = c(nci_83_99, nci_00_15)
write_rds(nci_83_15, "data/nci_83_15.rds")
You can see below what you’re supposed to get from each PDF file.
##    esearch.Proj..      X      X.1    X.2      X.3    X.4      X.5    X.6
## 1   Noncompeting  1,927  287,425  1,877  292,544  1,975  340,245  2,110
## 2   Admin. Supp.  (106)    6,439  (188)   11,068  (161)    7,766  (137)
## 3      Competing    886  111,896    969  157,635  1,017  168,464    950
## 4 Subtotal, RPGs  2,813  405,760  2,846  461,247  2,992  516,475  3,060
## 5       BIR/STTR      0        0      0        0      0        0      0
## 6 Subtotal, RPGs  2,813  405,760  2,846  461,247  2,992  516,475  3,060
##        X.7    X.8      X.9   X.10     X.11   X.12     X.13   X.14     X.15
## 1 390,678  2,042  412,433  2,078  451,481  2,374  558,057  2,288  561,149
## 2   6,986  (178)   12,527  (157)    8,544  (114)    6,177  (126)    7,187
## 3 161,496  1,061  218,193    979  205,378    728  158,775    728  171,144
## 4 559,160  3,103  643,153  3,057  665,403  3,102  723,009  3,016  739,480
## 5       0      0        0      0        0      0        0      0        0
## 6 559,160  3,103  643,153  3,057  665,403  3,102  723,009  3,016  739,480
##     X.16     X.17   X.18    X.19
## 1 2,207  588,860  2,231  610,532
## 2 (119)    5,672  (180)    9,474
## 3   840  197,016  1,079  253,851
## 4 3,047  791,548  3,310  873,857
## 5     0        0      0        0
## 6 3,047  791,548  3,310  873,857
After some data cleaning, we’re done! You can find the code for loading and cleaning the data at the end of the post. Keep in mind that the table selection tool might not always work as you expect (e.g. selects an extra row), and the code is sensitive to that. The main things we need to do are
- Rename the columns and standardize the funding mechanism names (e.g. Admin supp v.s. administrative supplement)
- Parse the numbers e.g. so that R recognizes
$1,000as1000;readr::parse_numbermakes this a cinch - Reshape the data so that it’s tidy
Let’s do some plots to make sure things look alright.

From a quick inspection the time series looks alright. We can see the rapid rise in funding due to the doubling of the NIH budget from 1998 to 2003, and followed by the flatness in funding since then. But even before the doubling, funding had already been on an upward trajectory from 1983, except between 1993 to 1995. From a historical perspective, the funding stagnation in funding since 2003 is an unusual event.
To make the same point in a slightly different way, I plotted the percentage change in funding from the previous year. There is only one year with a decrease in nominal funding pre-2003, compared to six instance of funding decreases after 2003.

Code for extracting and cleaning PDF data
library(tidyverse)
library(magrittr)
library(stringr)
library(tabulizer)

datadir = str_c(here(), "/data")

# Download PDFs
download.file("https://officeofbudget.od.nih.gov/pdfs/spending_history/Mechanism%20Detail%20by%20IC,%20FY%201983%20-%20FY%201999.pdf", destfile = str_c(datadir, "/ic_funds_83_99.pdf"))
download.file("https://officeofbudget.od.nih.gov/pdfs/FY17/Mechanism%20Detail%20by%20IC%20FY%202000-FY%202015%20V.pdf", destfile = str_c(datadir, "/ic_funds_00_15.pdf"))

# Enter interactive mode to select desired tables, which are returned as a list
nci_83_99 = extract_areas(str_c(datadir, "/ic_funds_83_99.pdf"), pages = 1:2,
                          method = 'data.frame')
nci_00_15 = extract_areas(str_c(datadir, "/ic_funds_00_15.pdf"), pages = 1:2,
                          method = 'data.frame')

nci_83_15 = c(nci_83_99, nci_00_15)

# Clean extracted data
# rename variables and standardize the "mechanism" column
mechanisms = c("noncompeting", "admin supplements", "competing", "total", "sbir-sttr", "total_with_sbir_sttr")

cols_83_92 = str_c(c('nawards', 'totalfunding'), sort(rep(1983:1992, 2)), sep = '_')
cols_93_99 = str_c(c('nawards', 'totalfunding'), sort(rep(1993:1999, 2)), sep = '_')
cols_00_07 = str_c(c('nawards', 'totalfunding'), sort(rep(2000:2007, 2)), sep = '_')
cols_08_15 = str_c(c('nawards', 'totalfunding'), sort(rep(2008:2015, 2)), sep = '_')

namelist = list(cols_83_92, cols_93_99, cols_00_07, cols_08_15)

nci_83_15_renamed = map(1:4, function(i){
  nci_83_15[[i]] = setNames(nci_83_15[[i]], c("mechanism", namelist[[i]]))
  nci_83_15[[i]][, 1] = mechanisms
  nci_83_15[[i]]
  })

# Combine the four tables and reshape
x = nci_83_15_renamed[[1]]
for (i in 2:4){
  x = inner_join(x, nci_83_15_renamed[[i]])
}

x = tbl_df(x)

nci_df = x %>%
  gather(stat_year, num, -mechanism) %>%
  mutate(num = parse_number(num)) %>%
  separate(stat_year, c('stat', 'fiscalyear'), sep = '_', convert = TRUE) %>%
  spread(stat, num) %>%
  mutate(totalfunding = totalfunding * 1000) # numbers are in thousands of dollars
Leave a Comment